Are high water levels influenced by environmental change?
Does some environmental condition have an effect on water quality/etc?
Does a drug or treatment have some effect?
Onus probandi incumbit ei qui dicit, non ei qui negat
Core assumption: Burden of proof is on someone claiming an effect (or a similar hypothesis).
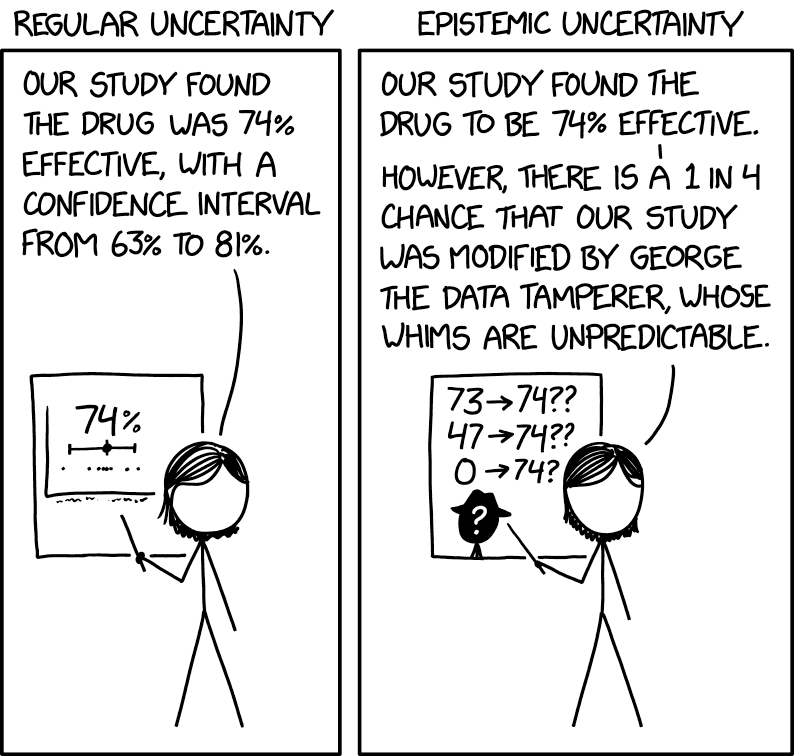
Null Hypothesis Meme
Null Hypothesis Significance Testing
Check if the data is consistent with a “null” model;
If the data is unlikely from the null model (to some level of significance), this is evidence for the alternative.
If the data is consistent with the null, there is no need for an alternative hypothesis.
Alternative Hypothesis Meme
From Null Hypothesis to Null Model
…the null hypothesis must be exact, that is free of vagueness and ambiguity, because it must supply the basis of the ‘problem of distribution,’ of which the test of significance is the solution.
— R. A. Fisher, The Design of Experiments, 1935.
Example: High Water Nonstationarity
Code
# load SF tide gauge data# read in data and get annual maximafunctionload_data(fname) date_format =DateFormat("yyyy-mm-dd HH:MM:SS")# This uses the DataFramesMeta.jl package, which makes it easy to string together commands to load and process data df =@chain fname begin CSV.read(DataFrame; header=false)rename("Column1"=>"year", "Column2"=>"month", "Column3"=>"day", "Column4"=>"hour", "Column5"=>"gauge")# need to reformat the decimal date in the data file@transform:datetime =DateTime.(:year, :month, :day, :hour)# replace -99999 with missing@transform:gauge =ifelse.(abs.(:gauge) .>=9999, missing, :gauge)select(:datetime, :gauge)endreturn dfenddat =load_data("data/surge/h551.csv")# detrend the data to remove the effects of sea-level rise and seasonal dynamicsma_length =366ma_offset =Int(floor(ma_length/2))moving_average(series,n) = [mean(@view series[i-n:i+n]) for i in n+1:length(series)-n]dat_ma =DataFrame(datetime=dat.datetime[ma_offset+1:end-ma_offset], residual=dat.gauge[ma_offset+1:end-ma_offset] .-moving_average(dat.gauge, ma_offset))# group data by year and compute the annual maximadat_ma =dropmissing(dat_ma) # drop missing datadat_annmax =combine(dat_ma -> dat_ma[argmax(dat_ma.residual), :], groupby(transform(dat_ma, :datetime =>x->year.(x)), :datetime_function))delete!(dat_annmax, nrow(dat_annmax)) # delete 2023; haven't seen much of that year yetrename!(dat_annmax, :datetime_function =>:Year)select!(dat_annmax, [:Year, :residual])dat_annmax.residual = dat_annmax.residual /1000# convert to m# make plotsp1 =plot( dat_annmax.Year, dat_annmax.residual; xlabel="Year", ylabel="Annual Max Tide Level (m)", label=false, marker=:circle, markersize=5, tickfontsize=16, guidefontsize=18, left_margin=5mm, bottom_margin=5mm)n =nrow(dat_annmax)linfit =lm(@formula(residual ~ Year), dat_annmax)pred =coef(linfit)[1] .+coef(linfit)[2] * dat_annmax.Yearplot!(p1, dat_annmax.Year, pred, linewidth=3, label="Linear Trend")
Figure 1: Annual maxima surge data from the San Francisco, CA tide gauge.
The Null: Is The Trend Real?
\(\mathcal{H}_0\) (Null Hypothesis):
The “trend” is just due to chance, there is no long-term trend in the data.
\[y = a \times t + b + \varepsilon, \qquad \varepsilon \sim Normal(0, \sigma^2) \]
Null Test
Comparing \(\mathcal{H}\) with \(\mathcal{H}_0\):
\(\mathcal{H}\): \(a \neq 0\)
\(\mathcal{H}_0\): \(a = 0\)
In this example, our null is an example of a point-null hypothesis.
Computing the Test Statistic
For this type of null hypothesis test, our test statistic is the slope of the OLS fit \[\hat{a} = \frac{\sum_{i=1}^n (x_i - \bar{x})(y_i - \bar{y})}{(x_i - \bar{x})^2}.\]
Assuming the null, the sampling distribution of the statistic is \[\frac{\hat{a}}{SE_{\hat{a}}} \sim t_{n-2}.\]
Statistical Significance
Is the value of the test statistic consistent with the null hypothesis?
More formally, could the test statistic have been reasonably observed from a random sample given the null hypothesis?
p-Values: Quantification of “Surprise”
One-Tailed Test:
Figure 2: Illustration of a p-value
Two-Tailed Test:
Figure 3: Illustration of a two-tailed p-value
Statistical Significance
Error Types
Null Hypothesis Is
True
False
Decision About Null Hypothesis
Don’t reject
True negative (probability \(1-\alpha\))
Type II error (probability \(\beta\))
Reject
Type I Error (probability \(\alpha\))
True positive (probability \(1-\beta\))
Navigating Type I and II Errors
The standard null hypothesis significance framework is based on balancing the chance of making Type I (false positive) and Type II (false negative) errors.
Idea: Set a significance level \(\alpha\) which is an “acceptable” probability of making a Type I error.
Aside: The probability \(1-\beta\) of correctly rejecting \(H_0\) is the power.
p-Value and Significance
Common practice: If the p-value is sufficiently small (below \(\alpha\)), reject the null hypothesis with \(1-\alpha\) confidence, or declare that the alternative hypothesis is statistically significant at the \(1-\alpha\) level.
This can mean:
The null hypothesis is not true for that data-generating process;
The null hypothesis is true but the data is an outlying sample.
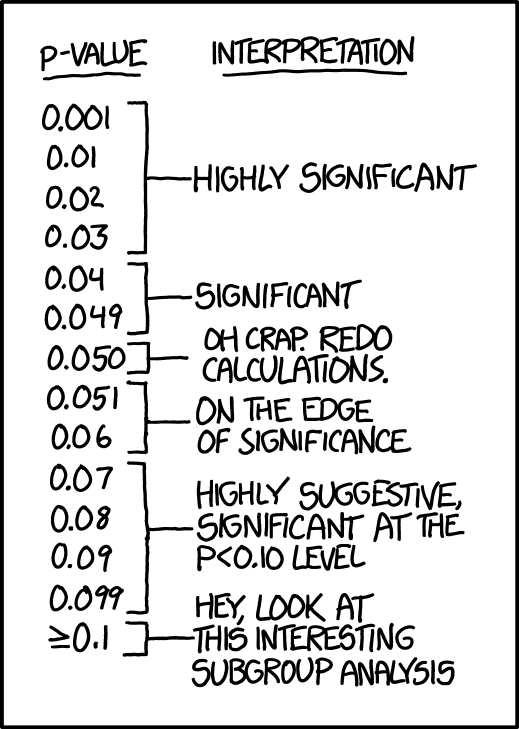
What p-Values Are Not
Probability that the null hypothesis is true (this is never computed);
An indication of the effect size (or the stakes of that effect).
The null hypothesis approach, as described here and typically practiced has empirically failed to maintain rigor and credibility in the scientific literature (Ioannidis, 2005; Szucs & Ioannidis, 2017).
How Could Stats Do This Meme
Source: Richard McElreath
Practical Results of NHST
Overconfident confidence intervals;
Strawman null hypotheses;
Biased sampling;
Lack of replications;
p-hacking.
How Could Stats Do This Meme
Source: Richard McElreath
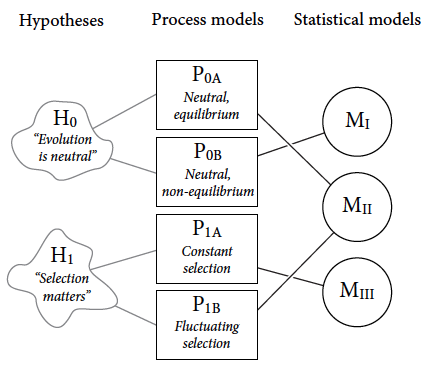
What Might Be More Satisfying?
Consideration of multiple plausible (possibly more nuanced) hypotheses.
Assessment/quantification of evidence consistent with different hypotheses.
Identification of opportunities to design experiments/learn.
Insight into the effect size.
Note: This Does Not Mean Null Hypothesis Testing Is Useless!
Examining and testing the implications of competing models is important, including “null” models!
Null Hypothesis Selection Good Vs. Bad
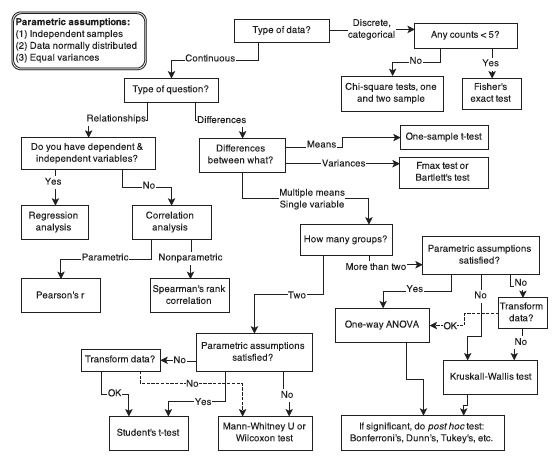
Key Points
Hypothesis Testing
Classical framework: Compare a null hypothesis (no effect) to an alternative (some effect)
\(p\)-value: probability (under \(H_0\)) of more extreme test statistic than observed.
“Significant” if \(p\)-value is below a significance level reflecting acceptable Type I error rate.
Problems with NHST framework
\(p\)-values are often over-interpreted and are often be incorrectly calculated, with negative outcomes!
Important: “Big” data can make things worse, as NHST is highly sensitive to small but evidence effects.
Szucs, D., & Ioannidis, J. P. A. (2017). When null hypothesis significance testing is unsuitable for research: A reassessment. Front. Hum. Neurosci., 11, 390. https://doi.org/10.3389/fnhum.2017.00390