Probability Fundamentals
Lecture 03
January 29, 2025
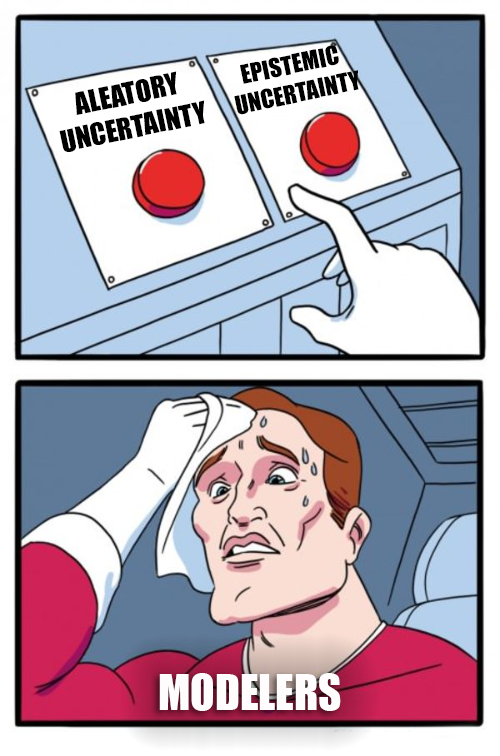
Types of Uncertainty
| Uncertainty Type | Source | Example(s) |
|---|---|---|
| Aleatory uncertainty | Randomness | Dice rolls, Instrument imprecision |
| Epistemic uncertainty | Lack of knowledge | Climate sensitivity, Premier League champion |
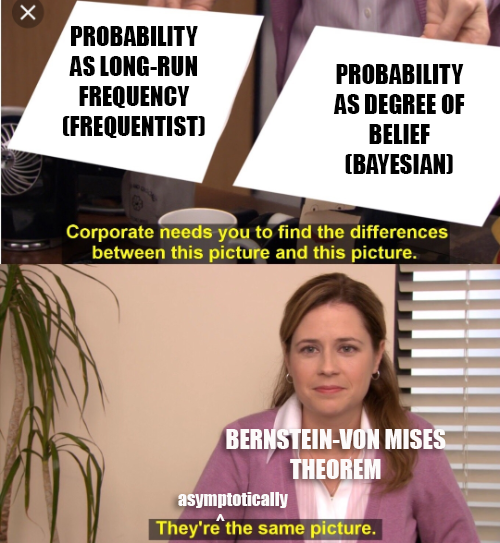
But What, Like, Is Probability?
Frequentist vs. Bayesian: different interpretations with some different methods and formalisms.
We will freely borrow from each school depending on the purpose and goal of an analysis.
Why Use a Normal Distribution?
Two main reasons to use linear models/normal distributions:
- Inferential: “Least informative” distribution assuming knowledge of just mean and variance;
- Generative: Central Limit Theorem (summed fluctuations are asymptotically normal)

Source: r/GymMemes
Sampling Distributions
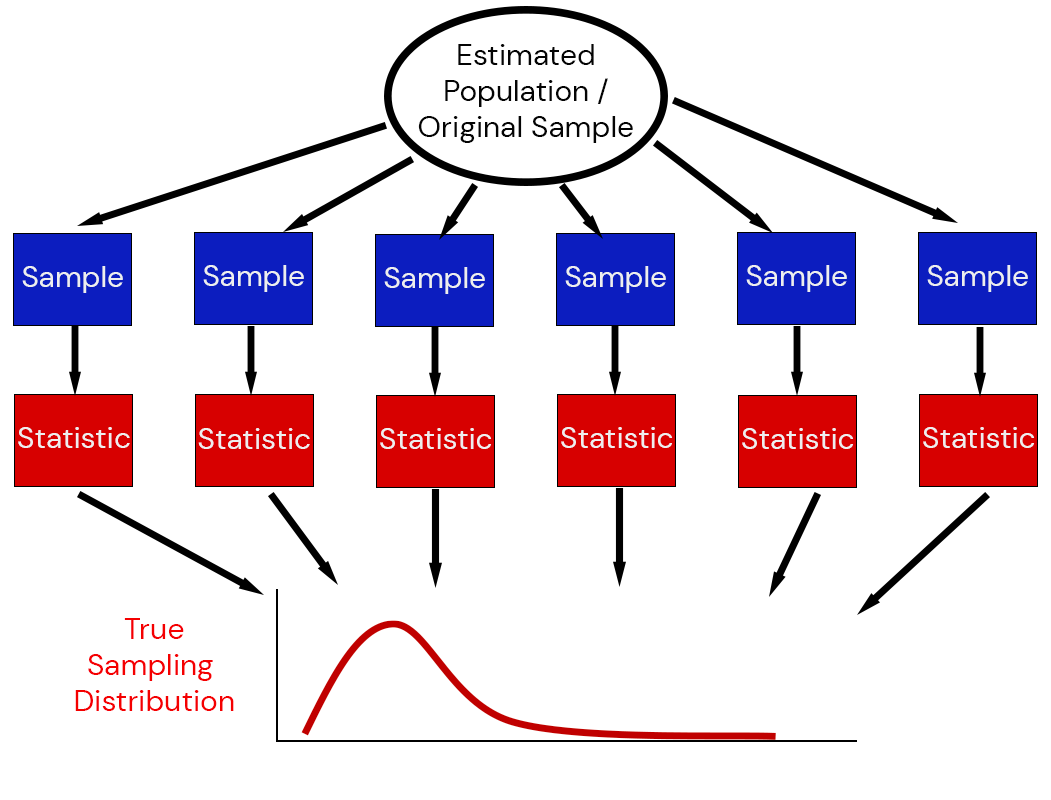
Illustration of the Sampling Distribution
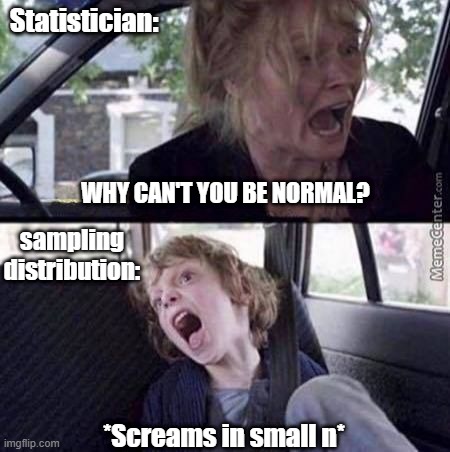
Central Limit Theorem (More Intuitive)
For a large enough set of samples, the sampling distribution of a sum or mean of random variables is approximately a normal distribution, even if the random variables themselves are not.
Source: Unknown
Generally Maximizing Likelihood
Can use optimization algorithms to maximize \(\theta \to \mathcal{L}(\theta | x).\)
Dragons: Probability calculations tend to under- and overflow due to floating point precision.
Confidence Intervals
Frequentist estimates have confidence intervals, which will contain the “true” parameter value for \(\alpha\)% of data samples.
No guarantee that an individual CI contains the true value (with any “probability”)!
