Modeling Extreme Values


Lecture 19

April 9, 2025

Review

Last Unit

Model Evaluation: How to assess and compare models for selection or assessment of evidence?

  • Over/Underfitting;
  • Scoring Rules
  • Cross-Validation;
  • Information Criteria

Extreme Values

What Are Some Examples of Extremes?

  • When An Event is Rare?
  • When A Variable Exceeds Some High Threshold?
  • When An Event Causes a Catastrophe?

Two Ways To Frame “Extreme” Values

These are values with a very low probability of occurring, not necessarily high-impact events (which don’t have to be rare!).

  1. “Block” extremes, e.g. annual maxima (block maxima)?
  2. Values which exceed a certain threshold (peaks over threshold)?

Example: Tide Gauge Data

Code
function load_data(fname)
    date_format = "yyyy-mm-dd HH:MM"
    # this uses the DataFramesMeta package -- it's pretty cool
    return @chain fname begin
        CSV.File(; dateformat=date_format)
        DataFrame
        rename(
            "Time (GMT)" => "time", "Predicted (m)" => "harmonic", "Verified (m)" => "gauge"
        )
        @transform :datetime = (Date.(:Date, "yyyy/mm/dd") + Time.(:time))
        select(:datetime, :gauge, :harmonic)
        @transform :weather = :gauge - :harmonic
        @transform :month = (month.(:datetime))
    end
end

dat = load_data("data/surge/norfolk-hourly-surge-2015.csv")

p1 = plot(dat.datetime, dat.gauge; ylabel="Gauge Measurement (m)", label="Observed", legend=:topleft, xlabel="Date/Time", bottom_margin=5mm, left_margin=5mm, right_margin=5mm)
Figure 1: 2015 tide gauge data from the Norfolk, VA tide gauge.

Example: Tide Gauge Data

Code
plot!(p1, dat.datetime, dat.harmonic, label="Predicted", alpha=0.7)
Figure 2: 2015 tide gauge data with predicted harmonics from the Norfolk, VA tide gauge.

Example: Detrended Data

Code
plot(dat.datetime, dat.weather; ylabel="Gauge Weather Variability (m)", label="Detrended Data", linewidth=3, legend=:topleft,  xlabel="Date/Time", bottom_margin=5mm, left_margin=5mm, right_margin=5mm)
Figure 3: 2015 detrended tide gauge data from the Norfolk, VA tide gauge.

Example: Block Maxima

Code
pbm = plot(dat.datetime, dat.weather; ylabel="Gauge Weather Variability (m)", label="Detrended Data", linewidth=2, legend=:topleft, xlabel="Date/Time", bottom_margin=5mm, left_margin=5mm, right_margin=5mm)
max_dat = combine(dat -> dat[argmax(dat.weather), :], groupby(transform(dat, :datetime => x->yearmonth.(x)), :datetime_function))
scatter!(max_dat.datetime, max_dat.weather, label="Monthly Maxima", markersize=5)
month_start = collect(Date(2015, 01, 01):Dates.Month(1):Date(2015, 12, 01))
vline!(DateTime.(month_start), color=:black, label=:false, linestyle=:dash)

p = histogram(
    max_dat.weather,
    normalize=:pdf,
    orientation=:horizontal,
    label=:false,
    xlabel="Count",
    bins=5,
    ylabel="",
    yticks=[]
)

l = @layout [a{0.7w} b{0.3w}]
plot(pbm, p; layout=l, link=:y, ylims=(-0.4, 1.4), bottom_margin=5mm, left_margin=5mm)
plot!(size=(1000, 450))
Figure 4: 2015 detrended tide gauge data from the Norfolk, VA tide gauge.

Example: Peaks Over Threshold

Code
thresh = 0.5
ppot = plot(dat.datetime, dat.weather; linewidth=2, ylabel="Gauge Weather Variability (m)", label="Observations", legend=:top, xlabel="Date/Time")
hline!([thresh], color=:red, linestyle=:dash, label="Threshold")
scatter!(dat.datetime[dat.weather .> thresh], dat.weather[dat.weather .> thresh], markershape=:x, color=:black, markersize=3, label="Exceedances")

p2 = histogram(
    dat.weather[dat.weather .> thresh],
    normalize=:pdf,
    orientation=:horizontal,
    label=:false,
    xlabel="Count",
    ylabel="",
    yticks=[]
)

l = @layout [a{0.7w} b{0.3w}]
plot(ppot, p2; layout=l, link=:y, ylims=(-0.4, 1.4), bottom_margin=5mm, left_margin=5mm)
plot!(size=(1000, 450))
Figure 5: 2015 detrended tide gauge data from the Norfolk, VA tide gauge.

Block Maxima

Block Maxima

Given independent and identically-distributed random variables \(X_1, X_2, \ldots, X_{mk}\), what is the distribution of maxima of “blocks” of size \(m\):

\[\tilde{X}_i = \max_{(i-1)m < j \leq im} X_j,\]

for \(i = 1, 2, \ldots, k\)?

How Are Maxima Distributed?

Consider the CDF \(F_X\) of \(X\) and let \(Y_n = \max \{X_1, \ldots, X_n \}\).

\[ \begin{align*} F_{Y_n}(z) &= \mathbb{P}[Y_n \leq z] \\ &= \mathbb{P}(X_1 \leq z, \ldots, X_n \leq z) \\ &= \mathbb{P}(X_1 \leq z) \times \ldots \times \mathbb{P}(X_n \leq z) \\ &= \mathbb{P}(X \leq z)^n = F_X^n(z) \end{align*} \]

This means that errors in estimating \(F_X\) become exponentially worse for \(F_{Y_n}\).

Sum-Stable Distributions

If we have independent and identically-distributed variables$\(X_1, X_2, \ldots, X_n\).

\[Y_1 = \sum_{i=1}^k X_i, \quad Y_2 = \sum_{i={k+1}}^{2k} X_i, \quad \ldots, \quad Y_m = \sum_{i={n-k+1}}^{n} X_i\]

Sum-Stability: \(Y \stackrel{d}{=} a_kX + b_k\) for some constants \(a, b \geq 0\).

Example: If \(X \sim N(\mu, \sigma)\), \(Y \sim N(k\mu, k\sigma)\)

Max Stability

\[\begin{align*} \max\{x_1, \ldots, &x_{2n}\}\\ &= \max\{\max\{x_1, \ldots, x_n\}, \max\{x_{n+1}, \ldots, x_2n\} \} \end{align*}\]

Figure 6: 2015 detrended tide gauge data from the Norfolk, VA tide gauge.

Stability Postulate

By analogy with sum stability, postulate that for a max-stable process,

\[F^n(z) = F(a_n z + b_n)\]

for some constants \(a_n, b_n \geq 0\).

Extremal Types Theorem

Let \(X_1, \ldots, X_n\) be a sample of i.i.d. random variables.

If a limiting distribution for \(Y = \max\{X_1, \ldots, X_n\}\) exists, it can only by given as a Generalized Extreme Value (GEV) distribution:

\[H(y) = \exp\left\{-\left[1 + \xi\left(\frac{y-\mu}{\sigma}\right)\right]^{-1/\xi}\right\},\] defined for \(y\) such that \(1 + \xi(y-\mu)/\sigma > 0\).

GEV Distributions

GEV distributions have three parameters:

  • location \(\mu\);
  • scale \(\sigma > 0\);
  • shape \(\xi\).

GEV “Types”

  • \(\xi > 0\): Frèchet (heavy-tailed)
  • \(\xi = 0\): Gumbel (light-tailed)
  • \(\xi < 0\): Weibull (bounded)
Code
p1 = plot(-2:0.1:6, GeneralizedExtremeValue(0, 1, 0.5), linewidth=3, color=:red, label=L"$\xi = 1/2$", lw=3)
plot!(-4:0.1:6, GeneralizedExtremeValue(0, 1, 0), linewidth=3, color=:green, label=L"$\xi = 0$", lw=3)
plot!(-4:0.1:2, GeneralizedExtremeValue(0, 1, -0.5), linewidth=3, color=:blue, label=L"$\xi = -1/2$", lw=3)
scatter!((-2, 0), color=:red, label=:false)
scatter!((2, 0), color=:blue, label=:false)
ylabel!("Density")
xlabel!(L"$x$")
plot!(size=(600, 450))
Figure 7: Shape of the GEV distribution with different choices of \(\xi\).

GEV Types

  • \(\xi < 0\): extremes are bounded (the Weibull distribution comes up in the context of temperature and wind speed extremes).
  • \(\xi > 0\): tails are heavy, and there is no expectation if \(\xi > 1\). Common for streamflow, storm surge, precipitation.
  • The Gumbel distribution (\(\xi = 0\)) is common for extremes from normal distributions, doesn’t occur often in real-world data.

Return Levels

Return Levels are a central (if poorly named) concept in risk analysis.

The \(T\)-year return level is the value expected to be observed on average once every \(T\) years.

From a GEV fit to annual maxima: \(T\)-year return level is the \(1-1/T\) quantile.

Return Periods

The return period of an extreme value is the inverse of the exceedance probability.

Example: The 100-year return period has an exceedance probability of 1%, e.g. the 0.99 quantile.

Return levels are associated with the analogous return period.

San Francisco Tide Gauge Data

Code
# load SF tide gauge data
# read in data and get annual maxima
function load_data(fname)
    date_format = DateFormat("yyyy-mm-dd HH:MM:SS")
    # This uses the DataFramesMeta.jl package, which makes it easy to string together commands to load and process data
    df = @chain fname begin
        CSV.read(DataFrame; header=false)
        rename("Column1" => "year", "Column2" => "month", "Column3" => "day", "Column4" => "hour", "Column5" => "gauge")
        # need to reformat the decimal date in the data file
        @transform :datetime = DateTime.(:year, :month, :day, :hour)
        # replace -99999 with missing
        @transform :gauge = ifelse.(abs.(:gauge) .>= 9999, missing, :gauge)
        select(:datetime, :gauge)
    end
    return df
end

d_sf = load_data("data/surge/h551.csv")

# detrend the data to remove the effects of sea-level rise and seasonal dynamics
ma_length = 366
ma_offset = Int(floor(ma_length/2))
moving_average(series,n) = [mean(@view series[i-n:i+n]) for i in n+1:length(series)-n]
dat_ma = DataFrame(datetime=d_sf.datetime[ma_offset+1:end-ma_offset], residual=d_sf.gauge[ma_offset+1:end-ma_offset] .- moving_average(d_sf.gauge, ma_offset))

# group data by year and compute the annual maxima
dat_ma = dropmissing(dat_ma) # drop missing data
dat_annmax = combine(dat_ma -> dat_ma[argmax(dat_ma.residual), :], groupby(transform(dat_ma, :datetime => x->year.(x)), :datetime_function))
delete!(dat_annmax, nrow(dat_annmax)) # delete 2023; haven't seen much of that year yet
rename!(dat_annmax, :datetime_function => :Year)
select!(dat_annmax, [:Year, :residual])
dat_annmax.residual = dat_annmax.residual / 1000 # convert to m

# make plots
p1 = plot(
    dat_annmax.Year,
    dat_annmax.residual;
    xlabel="Year",
    ylabel="Annual Max Tide Level (m)",
    label=false,
    marker=:circle,
    markersize=5
)
p2 = histogram(
    dat_annmax.residual,
    normalize=:pdf,
    orientation=:horizontal,
    label=:false,
    xlabel="Count",
    ylabel="",
    yticks=[]
)

l = @layout [a{0.7w} b{0.3w}]
plot(p1, p2; layout=l, link=:y, ylims=(1, 1.7), bottom_margin=5mm, left_margin=5mm)
plot!(size=(1000, 450))

# find GEV fit
# for most distributions we could use Distributions.fit(), but this isn't implemented in Distributions.jl for GEV
init_θ = [1.0, 1.0, 1.0]
gev_lik(θ) = -sum(logpdf(GeneralizedExtremeValue(θ[1], θ[2], θ[3]), dat_annmax.residual))
θ_mle = Optim.optimize(gev_lik, init_θ).minimizer
3-element Vector{Float64}:
 1.2587093828052343
 0.05626679672643659
 0.0171950735119165
Figure 8: Annual maxima surge data from the San Francisco, CA tide gauge.

GEV Parameters

  • \(\mu = 1\.26\)
  • \(\sigma = 0\.06\)
  • \(\xi = 0\.02\)
Code
p = histogram(
    dat_annmax.residual,
    normalize=:pdf,
    label="Data",
    xlabel="Annual Maximum (m)",
    ylabel="PDF",
    yticks=[],
    left_margin=10mm,
    right_margin=10mm
)

plot!(GeneralizedExtremeValue(θ_mle[1], θ_mle[2], θ_mle[3]), linewidth=5, label="GEV Fit", color=:gold4)
xlims!((1, 1.75))
plot!(size=(800, 500))
Figure 9: GEV fit to annual maxima of San Francisco Tide Gauge Data

GEV Return Levels

100-year return level: 1.53m

Code
gevcdf(x) = cdf(GeneralizedExtremeValue(θ_mle[1], θ_mle[2], θ_mle[3]), x) # find quantiles of values
rl_100 = quantile(GeneralizedExtremeValue(θ_mle[1], θ_mle[2], θ_mle[3]), 0.99)

plot(1:0.01:1.75, 1 .- gevcdf.(1:0.01:1.75), yaxis=:log, yticks=10 .^ collect(-3.0:1.0:0.0), xlabel="Water Level (m)", ylabel="Exceedance Probability (1/yr)", lw=3)
plot!(1:0.01:rl_100, 0.01 .+ zeros(length(1:0.01:rl_100)), color=:red, lw=2)
plot!(rl_100 .+ zeros(length(-4:0.01:-2)), 10 .^collect(-4.0:0.01:-2.0), color=:red, lw=2)
scatter!([rl_100], [0.01], color=:red, markersize=5)
plot!(size=(800, 500))
Figure 10: GEV fit to annual maxima of San Francisco Tide Gauge Data

GEV vs LogNormal

Code
p = histogram(
    dat_annmax.residual,
    normalize=:pdf,
    label="Data",
    xlabel="Annual Maximum (m)",
    ylabel="PDF",
    yticks=[],
    left_margin=10mm,
    right_margin=10mm
)
plot!(GeneralizedExtremeValue(θ_mle[1], θ_mle[2], θ_mle[3]), linewidth=5, label="GEV Fit", color=:gold4)
plot!(fit(LogNormal, dat_annmax.residual), linewidth=5, label="LogNormal Fit", color=:darkred)
xlims!((1, 1.75))
Figure 11: GEV fit to annual maxima of San Francisco Tide Gauge Data

GEV Q-Q Plot

Code
p1 = qqplot(GeneralizedExtremeValue(θ_mle[1], θ_mle[2], θ_mle[3]), dat_annmax.residual, 
    linewidth=3, markersize=5,
    xlabel="Theoretical Quantile",
    ylabel="Empirical Quantile"
)
plot!(p1, size=(600, 450))

return_periods = 2:500
# get GEV return levels
return_levels = quantile.(GeneralizedExtremeValue(θ_mle[1], θ_mle[2], θ_mle[3]), 1 .- (1 ./ return_periods))
# fit lognormal to get return levels for comparison
lognormal_fit = fit(LogNormal, dat_annmax.residual)
return_levels_lognormal = quantile.(lognormal_fit, 1 .- (1 ./ return_periods))

# function to calculate exceedance probability and plot positions based on data quantile
function exceedance_plot_pos(y)
    N = length(y)
    ys = sort(y; rev=false) # sorted values of y
    nxp = xp = [r / (N + 1) for r in 1:N] # exceedance probability
    xp = 1 .- nxp
    return xp, ys
end
xp, ys = exceedance_plot_pos(dat_annmax.residual)

p2 = plot(return_periods, return_levels, linewidth=5, color=:gold4, label="GEV Model Fit", bottom_margin=5mm, left_margin=5mm, right_margin=10mm, legend=:bottomright)
plot!(p2, return_periods, return_levels_lognormal, linewidth=5, color=:darkred, label="LogNormal Model Fit")
scatter!(p2, 1 ./ xp, ys, label="Observations", color=:black, markersize=6)
xlabel!(p2, "Return Period (yrs)")
ylabel!(p2, "Return Level (m)")
xlims!(-1, 300)
plot!(p2, size=(600, 450))

display(p1)
display(p2)
(a) GEV fit to annual maxima of San Francisco Tide Gauge Data
(b)
Figure 12

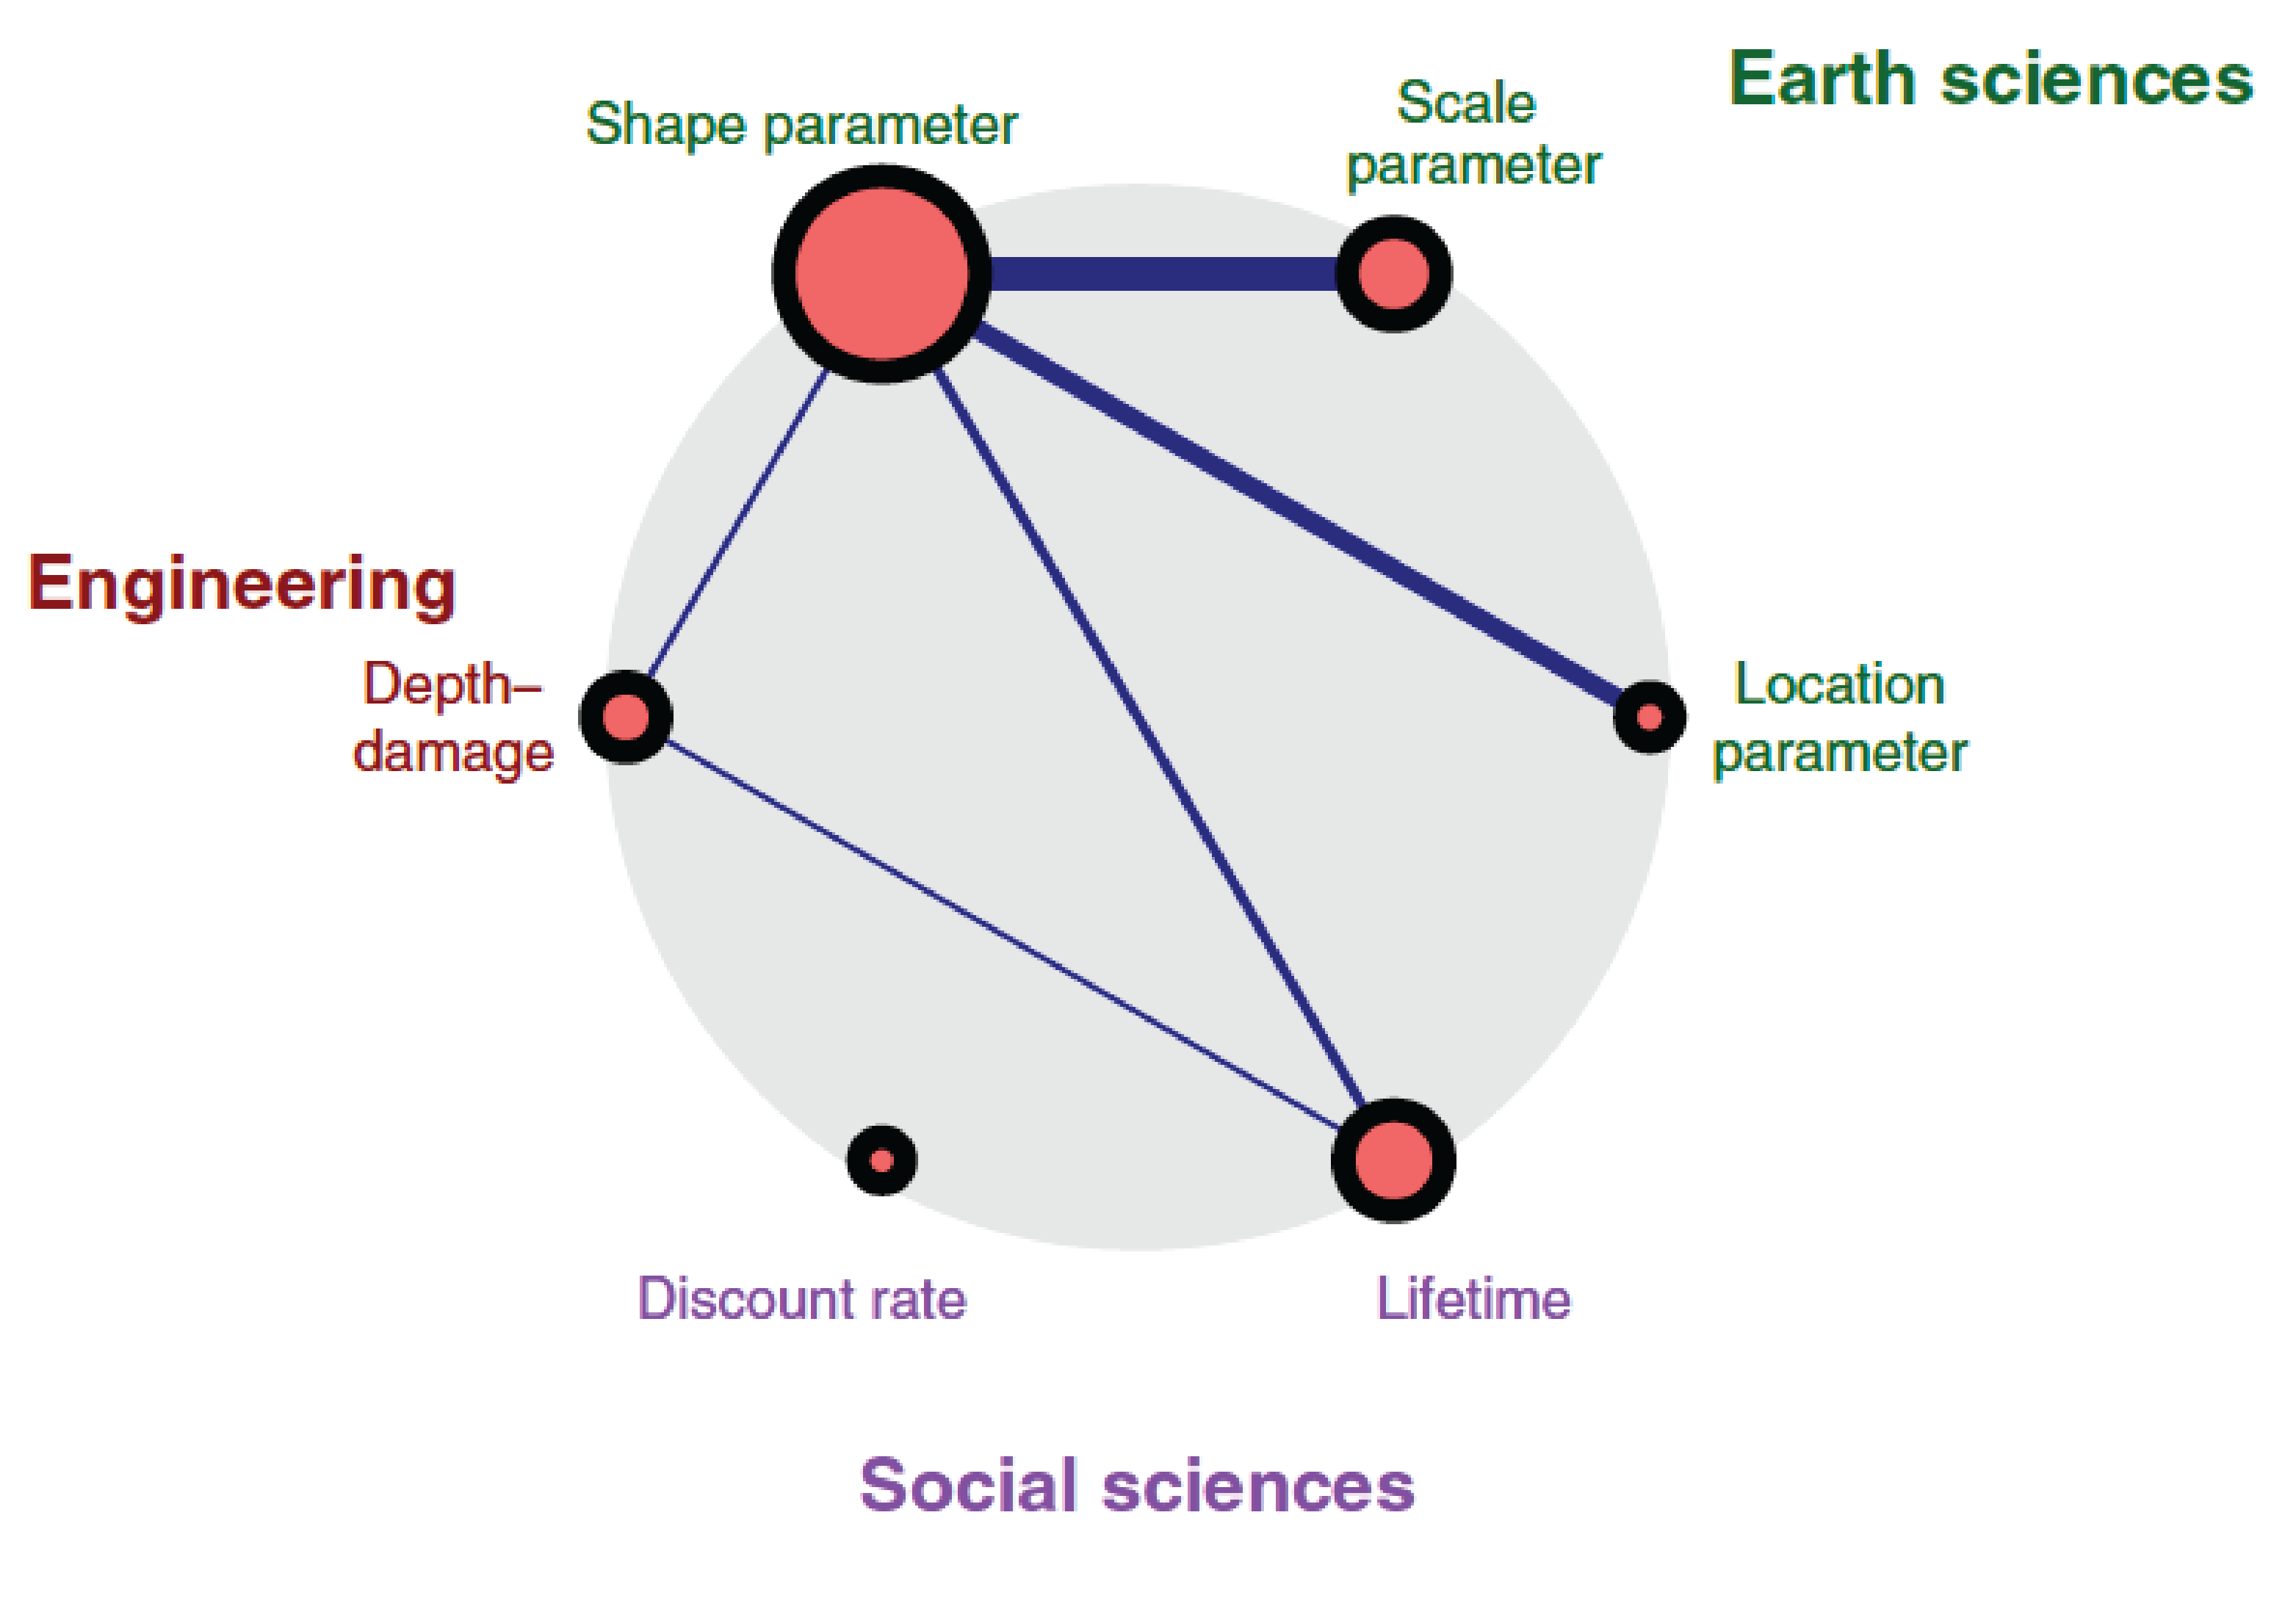
Be Careful About The Shape Parameter!

  • \(\xi\) can be difficult to constrain;
  • Often lots of uncertainty (large standard errors);
  • Controls frequency of “extreme” extremes

House flood risk sensitivity

Source: Zarekarizi et al. (2020)

Choosing a Block Size

  • Similar to the “bias-variance tradeoff”
  • Small block sizes: poor approximation by GEV, resulting in greater bias
  • Large block sizes: fewer data points, greater estimation variance
  • One year is common for practical reasons, but can go finer with sufficient data so long as block maxima can be treated as independent.

Getting Standard Errors

  • Fisher information: find Hessian of log-likelihood of GEV at MLE.
  • Parametric bootstrap from fitted GEV (will tend towards more narrow intervals)
  • Do not use the non-parametric bootstrap

Nonstationary Block Maxima

Nonstationary GEVs

Suppose block maxima can change with the block (e.g. climate change).

\[Y_i \sim GEV(\mu(x_i), \sigma(x_i), \xi(x_i))\]

Common to use generalized linear framework, e.g.

\[Y_i \sim GEV(\mu_0 + \mu_1 x_i, \sigma_0 + \sigma_1 x_i, \xi_0 + \xi_1 x_i)\]

Be Careful with Nonstationary GEVs

  • GEV parameters are already subject to large uncertainties; nonstationarity makes this worse.
  • Be particularly careful with non-stationary \(\xi\) (shape).
  • Most common approach: only treat \(\mu\) as non-stationary, \[Y_i \sim GEV(\mu_0 + \mu_1 x_i, \sigma, \xi)\]

Nonstationary Return Levels

No non-conditional return periods since distribution depends on \(x\).

First specify a covariate value \(x\), then can calculate return levels based on that value.

For example: what are 100-year return levels of temperatures in 2020, 2050, and 2100?

Upcoming Schedule

Upcoming Schedule

Monday: Peaks Over Thresholds

Wednesday: Missing and Censored Data

Assessments

Friday: HW4 Due

References

Zarekarizi, M., Srikrishnan, V., & Keller, K. (2020). Neglecting uncertainties biases house-elevation decisions to manage riverine flood risks. Nat. Commun., 11, 5361. https://doi.org/10.1038/s41467-020-19188-9